1 min læsning

I sometimes wonder, haven’t we seen all the possibilities for QlikView?
The answer is simple – NO!
The other day a client of my, asked if I could build some kind of a data warehouse monitor upon their enterprise data warehouse.
This client has a SQL Server data warehouse with QlikView as a frontend. The data in the data warehouse are updated in parallel processes, so data for each country are loaded in different time of the day. They also do ad hoc updates of the data warehouse if needed.
They have a nice log table in the SQL Server data warehouse, telling us when each ETL step is updated, and if there have been any errors in a step. However, reading this log is not that easy. Therefore, they asked if QlikView could visualize the data in some kind of a data warehouse monitor.
My idea was, why not create a one sheet overview, showing each of the component in the data warehouse architecture and visualize this? I wanted to use red and green icons and arrows showing witch part of the data warehouse is currently under update and if there were any errors to take care of.
I ended with this lovely solution:
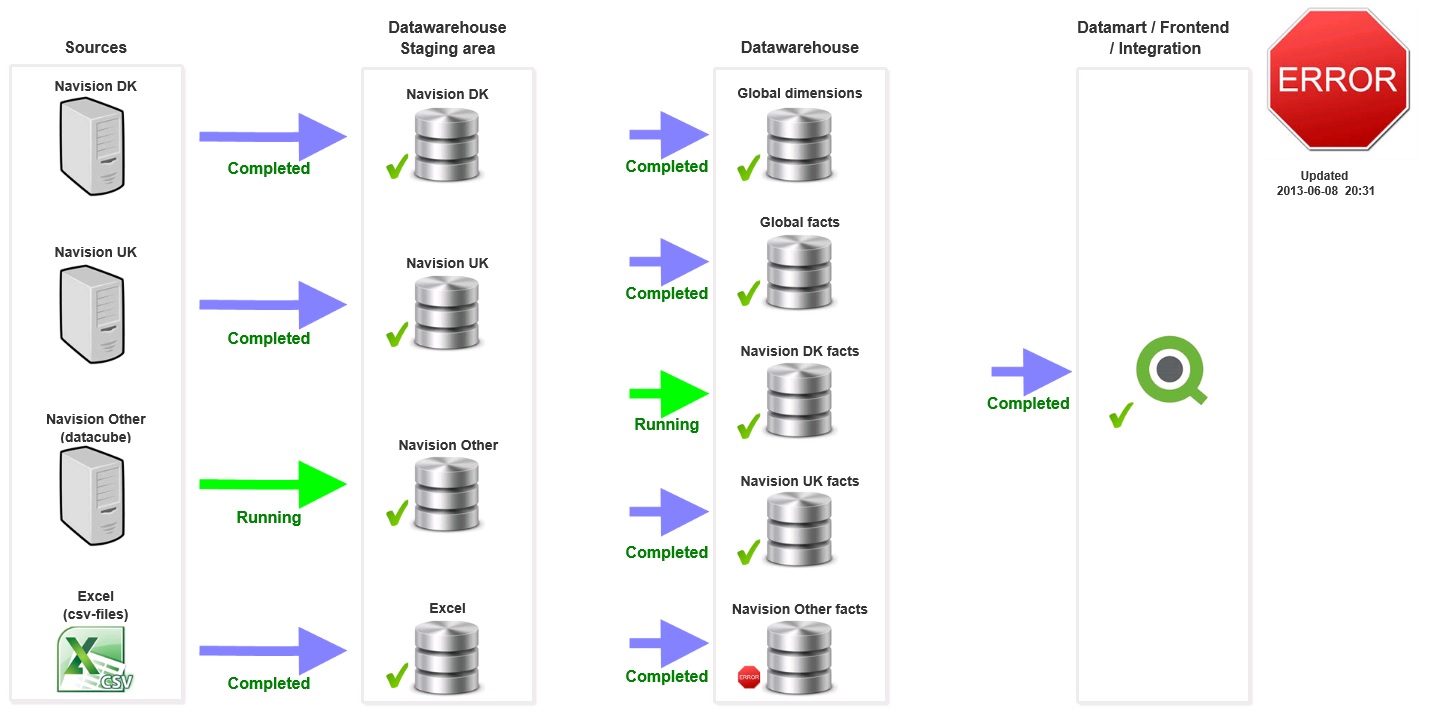
I have used text-boxes with images as background, color expressions and conditional show of objects.
Simple, very useful and hopefully a good inspiration.
Any questions?
Feel free to contact us if you have any questions: info@inspari.dk / +45 70 24 56 55.
Relaterede Posts
QlikView – how many records can you have in a document?
Triggered by a discussion last week, I just had to test how many records that could be stored in...
QlikView Meta data
Meta data in QlikView is much more than just comments of how a measure is calculated. In a...
A better alternative to long set analysis
When you work with QlikView, you have probably created tons of set analysis expressions, and many...