15 min læsning

Learn something that is not fancy!
What you are about to read isn´t trendy, isn´t fancy, isn´t new and probably isn´t for everyone. However, it might be available right at your fingertips. It might save you a whole lot of time and last, but not least, you might learn something new.
This is a blogpost about how you can leverage CUBEFORMULARS in Excel to build financial reporting that requires less maintenance, updates faster and lowers the complexity of your current reporting in Excel.
Okay, it is actually pretty easy because you only have to learn four new Excel formulars:
- CUBEMEMBER
- CUBEVALUE
- CUBESET
- CUBERANKEDMEMBER
If you already know these four, I advise you to read along anyway, because I hope to give you some examples that you probably haven´t used before.
First, a little bit of background as to why I still think that CUBEFORMULARS are important in the era of Power BI, Qlik, Tableau, etc. I do love interactive, well-designed and cool visual reports and dashboards that can do all kinds of crazy things, however, sometimes you just want to present you data in a matrix, were you control all the rules per cell. This is were CUBEFORMULARS come in handy, and in my opinion do a better job than other visualization tools.
A couple of disclaimers before we dig into how to use them. Dashboard creation with charts, colors, drill-downs, etc. has no place in Excel. There are examples out there on the internet showing you that you can, but just don’t. Use Power BI, Qlik or Tableau for that.
The basics
Since you are reading this, you are probably employed in a financial or business intelligence department. You are probably responsible for providing top management with boring matrix reporting heavily dependent on extracts from source systems, a whole bunch of VLOOKUPS and maybe also Excel sheets that reference one another on different file shares? In other words, you know your way around Excel.
Sounds like you? Well, you might already know that you have access to a CUBE/Tabular Model or you have heard that such a thing exists. As I previously wrote, it may already be available right at your fingertips, and that is a CUBE/Tabular model. Not sure? Ask your colleagues in your data warehouse or business intelligence department.
So, let’s dig into the first three CUBEFORMULARS:
- CUBEMEMBER(Connection, Member, Caption)
- It takes three arguments:
- Connection, which is the name of a connection to a cube in the Excel workbook
- Member, is the expression for pointing at a member in the cube
- Caption, is the name showed in the cell, if you would like to see something different than the actual member.
- It takes three arguments:
- CUBEVALUE(Connection, Member 1, Member 2, etc)
- It takes two arguments:
- Connection, which is the name of a connection to a cube in the Excel workbook
- All the members + óne and only one measure member for which you want to slice your data
- It takes two arguments:
- CUBESET(Connection, Set expression, Caption, Sort order, Sort by)
- It takes five arguments:
- Connection, which is the name of a connection to a cube in the Excel workbook
- Set expression, is an expression that returns a set of members
- Caption, is the name showed in the cell, if you would like to see something different than the actual member.
- Sort order, defines how to sort. You will be prompted with options
- Sort by, choose the member for which you would like to sort the set
- It takes five arguments:
Connection is the link to your data source, i.e. the CUBE/Tabular Model. Think of it as a constantly open phoneline to your data. Member is a sub set of this data. It is usually a field with a specific value. So if you for instance have some customer data in your model, a member could be a specific customer.
A very important thing is your connection. I won´t go into detail, just letting you know that your connection to the cube in the Excel workbook should be called something small and simple, since you will be using it all the time.
In the following examples, my connection is called “cube”.
So let’s get some examples on the table:
First, let’s look at CUBEMEMBER:
Return the customer with the customer name of Inspari:
=CUBEMEMBER("Cube";"[Customer].[Customer name].[Inspari]")
Return the customer business category with the name of “IT Consultancy”:
=CUBEMEMBER("Cube";"[Customer].[Customer Business Category].[IT Consultancy]")
Point to the measure that is called “Financial Amount LCY”:
=CUBEMEMBER("Cube";"[Measures].[Financial Amount LCY]")
Point to the measure that is called “Total Sales”:
=CUBEMEMBER("Cube";"[Measures].[Total Sales]")
The second formular is CUBESET:
A cubeset that returns in descending order based on Total Sales the customer names within the business category of IT consultancy:
=CUBESET("Cube";"([Customer].[Customer Business Category].[IT Consultancy], [Date].[Year].[2020], [Customer].[Customer Name].Children)";"Top 10 Selling Customers";2; ";"[Measures].[Total Sales]”)
The third formular is CUBEVALUE:
Provides the Total Sales for all customers called Inspari:
=CUBEVALUE(“Cube”;"[Customer].[Customer Name].[Inspari]";"[Measures].[Total Sales]")
Provides the Total Sales of year 2020 for the customer with a surrogate key of 15:
=CUBEVALUE(“Cube”;"[Customer].[Customer Key].&[15]" ; ”[Date].[Year].[2020]" ; ”[Measures].[Total Sales]")
That was the basic, and I do agree that it really was a very limited introduction.
To sum up: CUBEMEMBER points to a value in a field in your cube. E.g. a specific customer, CUBESET points to a specified set of members, e.g. Top 10 selling customers defined by various specifications (e.g. year or business category). CUBEVALUE gives the value of a measure in your CUBE/Tabular Model defined by various members in your model.
You’ll find plenty of blogs, articles, etc. that will talk you through the basics in more detail than I just did. So Google it, and let’s head into the more advanced stuff.
Building the right frame
Another quick disclaimer: I´m no reporting wizard. I can´t make it look good, I only care about the report being setup in the most transparent and easy to maintain way with as many cool and helpful technical features as possible.
Having the right frame for you report is key for building a robust report that does not require you to change too much for every adjustment needed.
My own rule of thumb is: “Last thing to build in the report is the actual values”
Thereby keeping focus on everything that surrounds the report. So, a frame consists of several things, and an example is provided below to give a general idea of how it could look.
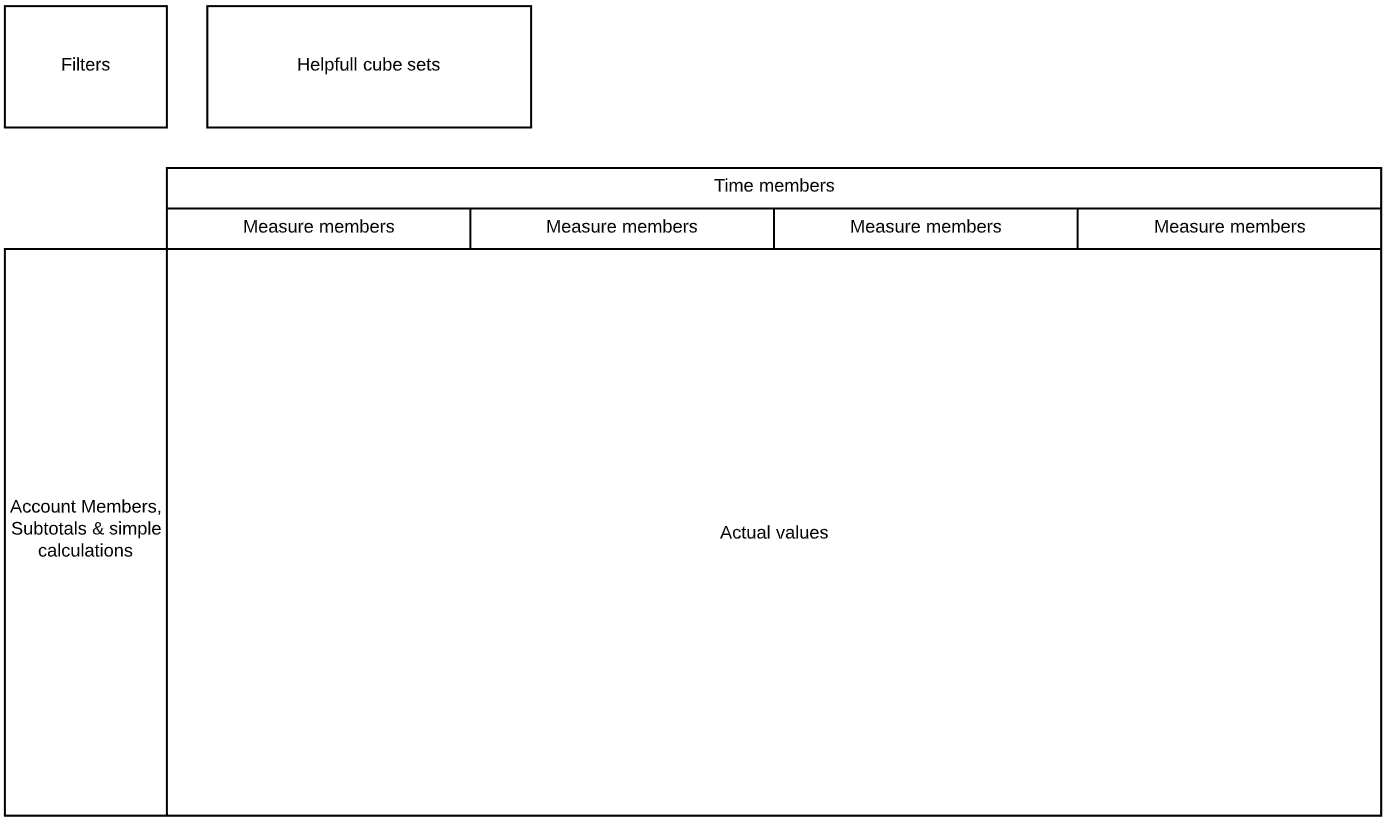
In the top left corner, you have your filters. Filters are all the things that your users have available for filtering the report. It’s important to get these right the first time, since most of your cubevalue calls will reference these. Changing them or adding new ones, means going through all cells again and again.
On the left side, you have the financial accounts, which essentially is cubemember that points to individual accounts in the cube. Also, since it is Excel, you can easily do simple subtotals and calculation which just use regular Excel functionality.
Next up is the top of your report area. There you will have to decide on your measures. Don´t think about the actual values, but only on what measures you what to display. In financial reporting, I often see cubes which have been designed with specific time relative measures for financial reporting, such as Amount, Amount QTD, Amount YTD, Amount Rolling 12M and Amount SPLY (Quarter-To-Date, Year-To-Date, Rolling Twelve Month, Same Periode Last Year). Depending on your report, it could be sales vs. cost or whatever is available. Try to find measures in you cube that provide you with the numbers needed and don’t require additional Excel calculation. That way your report is less complex, and you lower the risk of calculations not being aligned.
Also, in the top of the report, we have time series. Cubeformulars offer many a great way of working with time series in a simple way. So you have to decide which way to use time series. In many cases a financial report contains month numbers, the numbers for the quarter, the year to date numbers and sometimes even a comparison to the numbers from last year.
Lastly, we have the box in the top which has the text “helpful cubesets”. This is the toolbox for the report designer. This is were all the relevant building blocks should be created, thereby supporting your report requirements.
With your frame now in place, it´s time to get the actual values in the report (the area in the centre) retrieved through the CUBEVALUE function. As shown previously, the cubevalue function looks solely at other members + one measure member to provide a single value. This leads to my next rule of thumb:
“CUBEVALUE should only reference other cells with member expressions and never have expressions written directly in the function”
This is a way to test whether or not your frame holds up. If the CUBEVALUE function can provide you with the right numbers only by using members available in the frame, you are on the right track.
This concludes some of the considerations of building a proper frame for your reporting. Now, let’s get our hands dirty with an example that combines it all.
Getting our hands dirty with an example
Let’s dig into an actual example to get a better understanding of how we can tie it all together. We start by coming up with a prototype of how the report should look, with a heavy focus on how to structure the frame.
Picture below shows a report prototype created in Excel, which contains no functionality but only defines the frame of the report.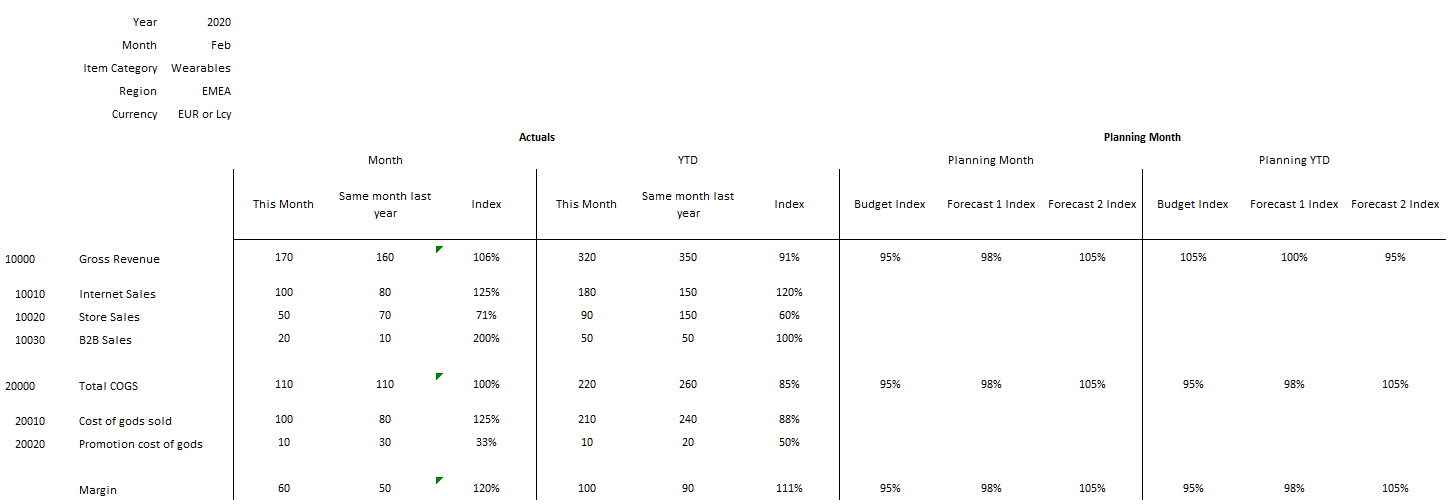
With the prototype in place, let’s try and make it to an actual working report. Showcasing this here is a bit difficult, so I have tried in a bit of an alternative way to make all functions explicit and show the relationships between the different fields. To understand the pictures in this next session, please pay attention to the following:
- All cubeformulars should of course start with an “=” sign to actually work in Excel
- Notations like this “month” means that it should be a reference to the field in Excel
- The values F1 to F5 and P1 to P10 are only used to show which fields to make references to when using the cubevalue function.
- The meaning of the color schema for the cubevalue function is shown where the function should be used in the report.
Below is a total overview of how I would built the report with cubeformulars. Not that easy to understand at first glance, so let me explain the different parts.
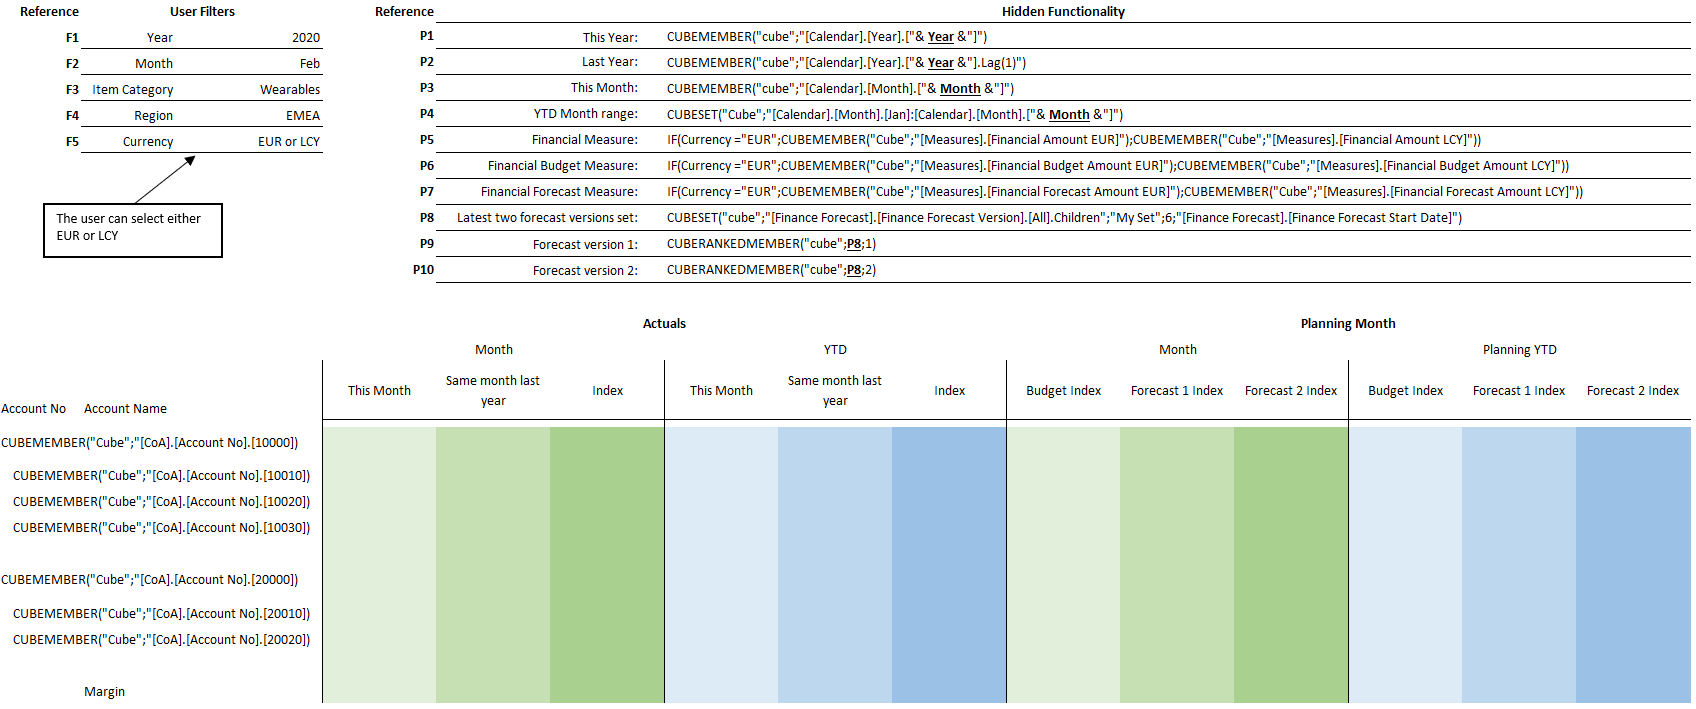
Below are the building blocks I would use to ensure that all cubevalue functions only reference other cells instead of contain expressions. Let’s look at some examples.
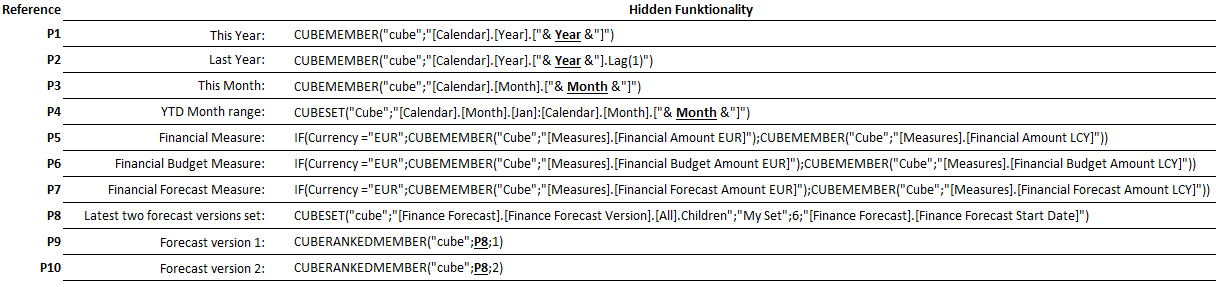
CUBEMEMBER("cube";"[Calendar].[Year].["& Year &"].Lag(1)")
This functions uses two things. First, we use a value from a different cell to pass in as a parameter. Here presented as the year, which in the example has the value of “2020”, meaning the function evaluates to the following CUBEMEMBER("cube";"[Calendar].[Year].[2020].Lag(1)"). Next, it uses the feature lag(1) which means: “give me be value that comes before 2020”. Which in this case is 2019. You can use lag(#) and lead(#) to either go forward or backwards in the members of an attribute.
CUBESET("Cube";"[Calendar].[Month].[Jan]:[Calendar].[Month].["& Month &"]")
Here we use a CUBESET function with a range feature and parsing in the value from a different cell, meaning that this cell will hold the value of several members. The range functionality is represented by the “:” colon sign, which is basically saying; “give me all month between Jan to XXX month”.
IF(Currency ="EUR";CUBEMEMBER("Cube";"[Measures].[Financial Amount EUR]");CUBEMEMBER("Cube";"[Measures].[Financial Amount LCY]"))
The next one is pretty straight forward and is included here to show how normal Excel functions can be combined with cubeformulars. So based on the user’s selection of either EUR or LCY, a specific measure member is selected. This provides the option of easily switching the report between EUR and LCY.
CUBESET("cube";"[Finance Forecast].[Finance Forecast Version].[All].Children";"My Set";6;"[Finance Forecast].[Finance Forecast Start Date]")
With the use of this cubeset formular, I want to get all Finance Forecast Version ordered descending by their start date. Essentially, I want to make sure that I dynamically get the two most recent versions. The important thing to notice here is the use of “.Children”. It basically means “give me all members of a specific attribute”. In this case the attribute Financial Forecast Version.
CUBERANKEDMEMBER("cube";P8;1)
The final and fourth cubeformular to go through is CUBERANKEDMEMBER. It is used to go through a CUBESET. I this case, I´m asking for the first member in the CUBESET that we just explained. Thereby giving me the most recent Finance Forecast Version.
This concludes the different building blocks needed to build the report. Next step is to extract some actual values. To do this, we use CUBEVALUE, which takes an X number of cubemember references. The most important thing to know is that you just point to the cell in which a cubemember function exists to include it in the value you want to extract.
With the frame of you report done right, this part is the easiest for all, since it is just a matter of pointing to the right cells.
Below is how I would get the desired values by using the available building blocks and the frame surrounding the report. The F# and P# reference should of course be normal Excel references instead.

When using a CUBEVALUE, you should think in terms of what you are trying to extract.
Take the very first example from above. It translates to:
- Extract the value where
- the account number is “10000”
- Item Category is equal to “Wearables”
- Region is equal to “EMEA
- the year is “2020”
- the month is “February”
- and finally do it for the measure called Financial Amount EUR or Financial Amount LCY depending on what the user has choosen.
Now do that for all cells, and your report is now populated with values that can easily be updated.
So why are these “building blocks” and this “frame” so important? They are important if you want to change your report. Perhaps you want to manually define which Finance Forecast Versions to look at, you just change it in the building blocks and your report will change accordingly. When you reach March, you just change the filter value to March and your month and year-to-date numbers are changed accordingly. No need to extract data from source systems, consolidate data, adjust lookups, etc.
Before the big conclusion, here are a couple of honorable mentions in regards to more advanced uses of cubeformulars:
Combined Set using range:
CUBESET("Cube";"{([Doc No].[Doc No].[S00755]:[Doc No].[Doc No].[S00799]), ([Doc No].[Doc No].[S00700]:[Doc No].[Doc No].[S00754])}")
Result: Return all document numbers from S00755 to S00799 and all document numbers from S00700 to S00764
Find in string Set:
CUBESET("Cube";"(FILTER([Doc No].[Doc No].MEMBERS, INSTR([Doc No].[Doc No].CURRENTMEMBER.NAME, ""S007"")>=1))")
Result: Return all documents containing the value “S007”
Find in string and exclude Set:
CUBESET("Cube";"EXCEPT((FILTER([Doc No].[Doc No].MEMBERS, INSTR([Doc No].[Doc No].CURRENTMEMBER.NAME, ""S007"")>=1)),{[Doc No].[Doc No].[S00700],[Doc No].[Doc No].[S00701]})";"My INSTR Filter + Except Set")
Result: Return all documents containing the value “S007”, except the values “S00700” and “S00701”
The samples above are to show that you can actually do a whole lot with cubeformulars and instead of building complex Excel logic, it´s sometimes better to focus on creating the right frame and building blocks to support the report you want.
Conclusion
I hope that this walkthrough has made you interested in using cubeformulars or perhaps shown you a more advanced way of using them. Cubeformulars are definitely not new nor fancy, they have been around for a long time and are considered really oldschool. However, I still find them useful under the right circumstances. One of my main reports I use on a daily basis is a home-made cubeformular dashboard in Excel tailored to my exact needs.
Even though this blogpost ended up being becoming more extensive than expected, there are still so many things that haven´t been shown and said. For all of this to work, you need a cube and that cube needs to be developed the right way and provide you with both the data needed, the right attributes for filtering and even more importantly the right measures that ensure that you report becomes as simple as possible.
From here, I hope that you will start experimenting with cubeformulars or improve already existing reports. I´m pretty certain that at some point you will run into problems. Error messages you don´t understand, behavior in data that you didn´t expect and maybe just a lack of data, attributes and measures. If that is the case, do give me or Inspari a call, we would love to help you. Two days of intensive training and report building goes a long way and ensures that you create better reports in half the time.
Check out some of the modern visualization tools:
Any questions?
Please reach out to info@inspari.dk or +45 70 24 56 55 if you have any questions. We are looking forward to hearing from you.
Relaterede Posts
Tableau - Making the Date dimension ready for Tableau
This is a technical follow up on the previous post on designing and working with cubes in Tableau.
Tableau - Designing and working with cubes in Tableau
In this article we will look at how the cube is structured and how to setup a date dimension what...
Microsoft Power Platform Summit
Three intensive days of presentations, discussions and learnings took place at the Power Platform...