6 min læsning
Tableau - Designing and working with cubes in Tableau
Af: Inspari Hubspot Leads 27. august 2013

In this article we will look at how the cube is structured and how to setup a date dimension what is easy to work with in Tableau.
I have used a quite well-known data set – at least for regular Tableau users. For this series of articles I have used the Sample –Superstore – English (Extract) that comes with Tableau 8. I have exported the data to Excel and remodeled the data in Excel to a regular star schema.
Structure of the cube
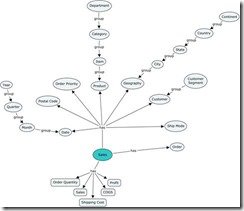
After the transformation the logical data model now looks like this:
More information on this way of conceptual modeling can be found here: Discovering Business Level Concept Models
Basically, we have one fact table (measure group in SSAS speak) called Sales and a number of dimensions (ovals connected directly to the fact table). Some of the dimensions have hierarchies like Date (with Month, Quarter and Year), Product (with Item, Category, and Department), Customer and Geography. We have from the start five measures (Sales, Profit, COGS, Shipping Cost and Order Quantity)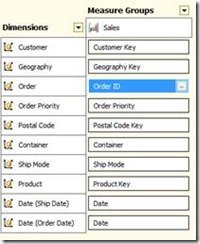
On the “Dimension Usage”-tab you can see how the dimensions relates to the measure group (fact table)
The cube structure is very simple as this is sample data and all of it comes from one flat file. For handling this little amount of data a cube is truly overkill. However, in some of the future articles we will look at how we can handle more complex scenarios with a cube and Tableau.
Connection to the cube from Tableau
You create a connection to a cube in the same as with other data sources.
Select Microsoft Analysis Services from the Data Connection tab
Enter the server name that you will connect to and press the Connect-button. (You may have to add additional user name and password – however for most scenarios you can connect using Windows Authentication)
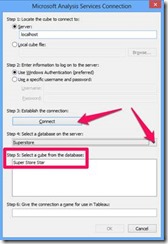
Select the database on the server – you will only see the databases that you have permission to see. Now you can see the different cubes in the selected database. The same goes here – you can only see cubes that you have permission to. You need to highlight the cube that you want to work with before the OK-button becomes active.
Choose the cube (here Super Store Star) and press OK and now the magic begins.
The first thing that becomes apparent is that the Data-card is looking different from when you connect to an ordinary relational table, SQL-query or Excel file.
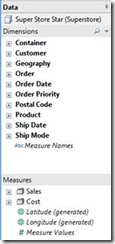 When you connect to a cube all measures and dimensions are positioned correct – there are no need to move numerical descriptions like Order ID or Customer number from measures to the dimensions. Measures are grouped nicely into display folders and Dimension-attributes are easy to navigate as they are connected to their connected to their dimensions.
Working with the Date-dimension
One of the issues I see most often on the Tableau forums concerning cubes have to do with the data dimension.
Cubes are an entirely different beast compared to relational data and extracts. The end-user has very limited options of changing anything on the cube from inside Tableau. Some of the cool stuff like automatic data hierarchies and conditional calculation will not work when you are working with a cube. However, fore more complex data structures and single version of the truth cubes is a great tool. You can be sure that the end-user gets the same numbers and calculations no matter the front-end tool they use on top of a cube. When you are working with cubes there are many things there are easy to do, but difficult when working with relational data.
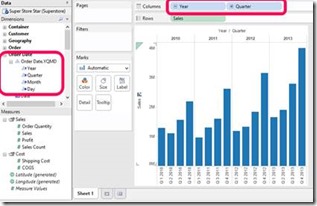
Here is a very regular date hierarchy that enables easy drill up and down – and in this context is works more or less like the usually automatic data hierarchy that you know from relational data sources in Tableau. However, you can’t move the hierarchy to the filter shelve and get the same relative time filters that you can with date from relational data sources.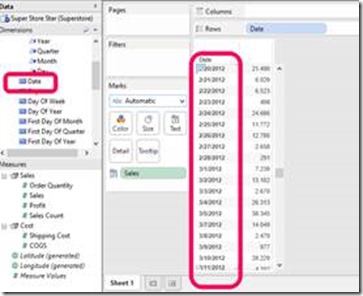
That is because Tableau does not recognize the data as dates.
In order to do that we need to have an attribute that Tableau understands is a date. In the dimension that is created here we have multiple attributes that is formatted in a way that Tableau can recognize as a date.
One of the attributes formatted as a date is the attribute Date
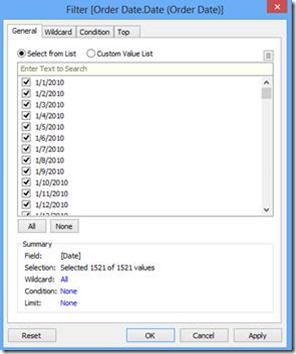
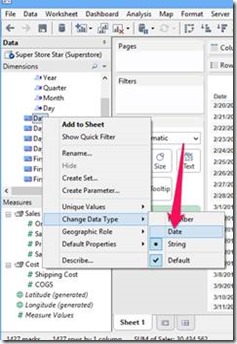
If you use it as it is you will get the regular filter list. However, if you change the data type from Default to Date
You can use the field as a relative date filter when the data type has been changed. Notice that the icon in front of the name changed to green and a date type and the formatting of the data in the visualization changed.
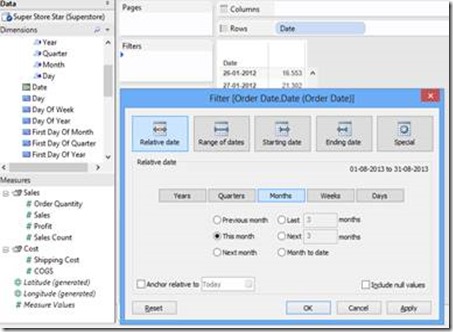
Be aware that for some types of visualisations this is working fine. However, the cube is returning data at the level of your filter. This means that this filter will return 31 discrete values (one for every day of august). If you are showing data on a daily level (one row per day) then this behavior is fine but often you want to look at it at a different level like month level. If you aggregate this at the month level you will get the dreaded “Overlapping Text” warning.
What you can do is to add attributes formatted like dates on both day, month, quarter and year (named First Day of Month etc.) level like done in the demo cube.
In this blogpost, I show how to do date filtering in another way
Any questions?
Please reach out to info@inspari.dk or +45 70 24 56 55 if you have any questions. We are looking forward to hearing from you.
Relaterede Posts
Tableau - Making the Date dimension ready for Tableau
This is a technical follow up on the previous post on designing and working with cubes in Tableau.
Tableau 10.5 - Hyper, Maestro og Extensions API
Sjældent har jeg glædet mig så meget til en ny version af et BI-værktøj, som jeg glæder mig til...
Tableau Conference 2018
Sammen med 17.000 deltagere sad jeg på nåle under både keynoten og ”Devs on Stage”. På den årlige...
