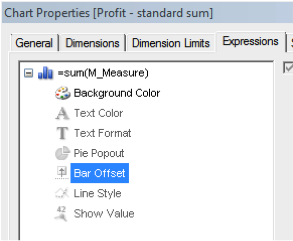
The use of bar offset gives you the possibility easily to make new types of bar charts. Among them the powerful Gantt and Waterfall chart.
With Bar Offset you can create an expression for calculating an offset for the bar or bar segment associated with the data point.
Maybe this sounds difficult, but actually it’s quite easy. You find Bar Offset under properties of an expression in a bar chart:
Gantt chart:
Let’s say you have the following data and would like to create a Gantt chart:
Waterfall Chart:
Let’s say you have the following data and would like to create a Waterfall chart:
And then you have your Waterfall chart!
In this case the background color is calculated by the expression: “if(sum(M_Measure)<0,LightRed())”
Any questions?
Please reach out to info@inspari.dk or +45 70 24 56 55 if you have any questions. We are looking forward to hearing from you.